
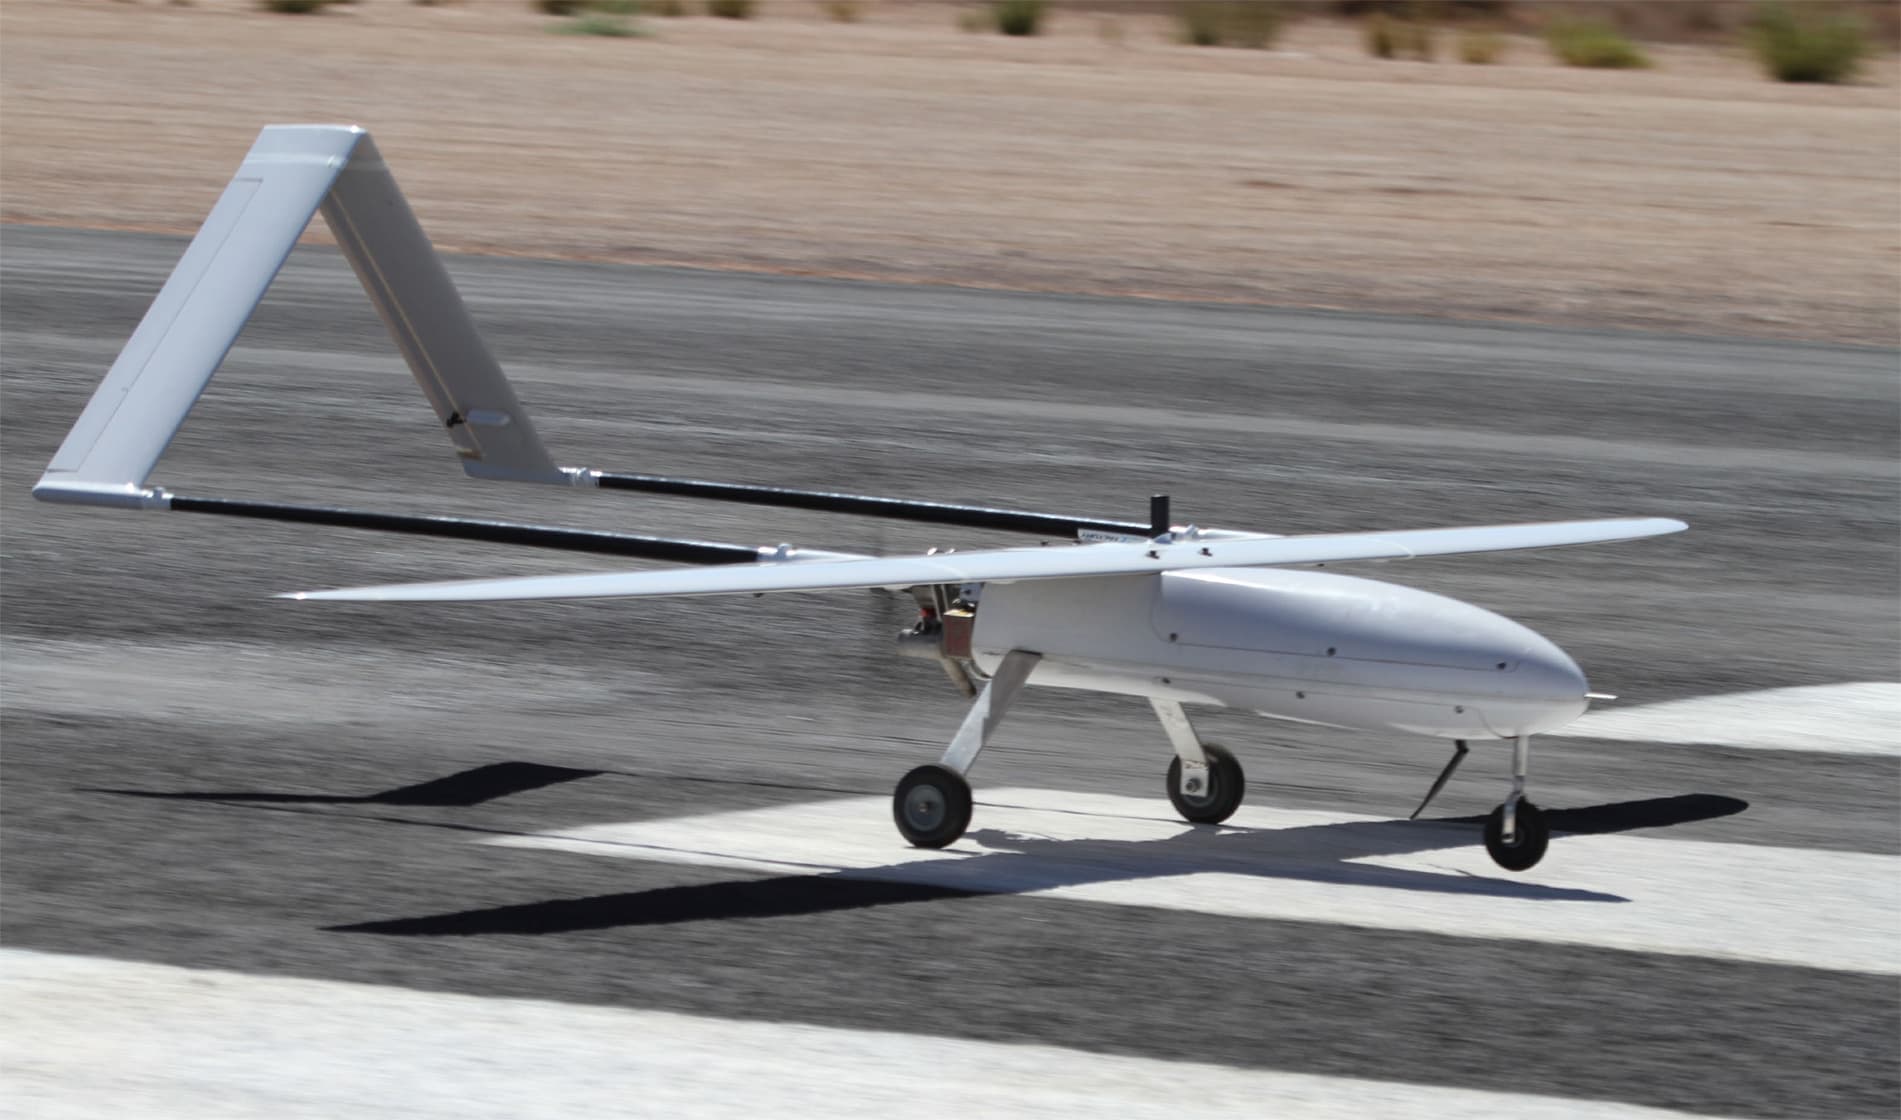
Aerial Surveys & Drone Mapping
Measured maps, 3D models and site data for mining, construction and infrastructure projects across Australia.
Aerial Surveys for Planning, Progress and Volumes
National Drones captures aerial survey data for mine sites, construction projects and infrastructure corridors across Australia. Use measured maps to plan works, compare site changes and quantify stockpiles. We start with your survey boundary, coordinate system and deliverables, then select the aircraft, sensor and control strategy for the site.
How it works
Photogrammetry: how drones map the world
See how overlapping photographs become maps and 3D models, with a worked survey example covering image detail and ground control.
2 minutes 56 seconds · English captions
Flight settings and ground control in the video illustrate one survey approach. We select the sensor, overlap, control and checkpoints for your site and agreed outputs.
Discuss your survey and mapping project
Read the video transcript and visual descriptions
Photogrammetry: how drones map the world.
Photogrammetry means measuring from photographs. The drone captures overlapping images, and software turns them into a model.
When a point appears in two or more photos from different positions, software triangulates its 3D position.
Out come an orthomosaic, a surface model and a 3D mesh. Their accuracy depends on four things.
GSD, ground sampling distance, is the size of one pixel on the ground. Fly higher and each photo covers more, but every pixel gets coarser.
GSD equals sensor width times height, over focal length times image width. Rearrange it to find your height.
For a Phantom 4 Pro at 2 centimetres per pixel, that's about 73 metres above ground.
Lower GSD gives more detail, but more images and longer processing. Match it to the job.
Quick check. You need finer detail. What happens to your flight height?
Fly lower. Finer GSD means a lower height.
Front overlap is 60 to 80 percent, 75 standard. Side overlap, between strips, is 60 to 70, 65 standard. Every point needs at least three images.
That sets the trigger interval. In the worked example, that's a shot every 27.4 metres: every 5.5 seconds at 5 metres per second.
Too fast for the camera? Slow down, or fly higher.
Buildings need an oblique orbit at about 45 degrees, plus a nadir roof pass. Corridors get a double grid, or one strip with very high overlap.
At the quarry, the crew lays ground control targets and surveys each one.
Ground control points have precisely surveyed coordinates. Without them, the shape is right, but position and scale can be off. With them, the model snaps into place.
Use at least five, around the perimeter, at high and low points, each in three or more images. Keep one or two as checkpoints.
The payoff: a stockpile model, with volume calculated from the surface model.
Recap. GSD sets your height. Overlap fills the gaps. The pattern fits the target. Ground control pins it down.
Final check. How many ground control points, and where?
At least five, spread around the perimeter.
Visual descriptions
The animation shows a shared point in overlapping photographs and triangulates its three-dimensional position. Outputs include an orthomosaic, a surface model and a mesh.
The GSD formula is sensor width times height above the ground, divided by focal length times image width in pixels. A Phantom 4 Pro worked example uses approximately 73 metres for 2 centimetres per pixel. GSD is image detail, not a guarantee of survey accuracy.
The first check asks how to obtain finer ground detail. The animation selects a lower flight height for the same camera.
The worked example illustrates 75 percent front overlap and 65 percent side overlap. It calculates a trigger spacing of 27.4 metres, or about 5.5 seconds at 5 metres per second. Actual overlap and capture settings depend on the site, sensor and processing requirements.
The quarry sequence shows surveyed control targets and a stockpile surface used for a volume calculation. Control points constrain the model, while separate checkpoints assess the results.
The final check compares three clustered points, at least five points around the perimeter, and one point at the highest location. The illustrated example selects at least five distributed points. Actual control and checkpoint numbers and locations depend on the project.
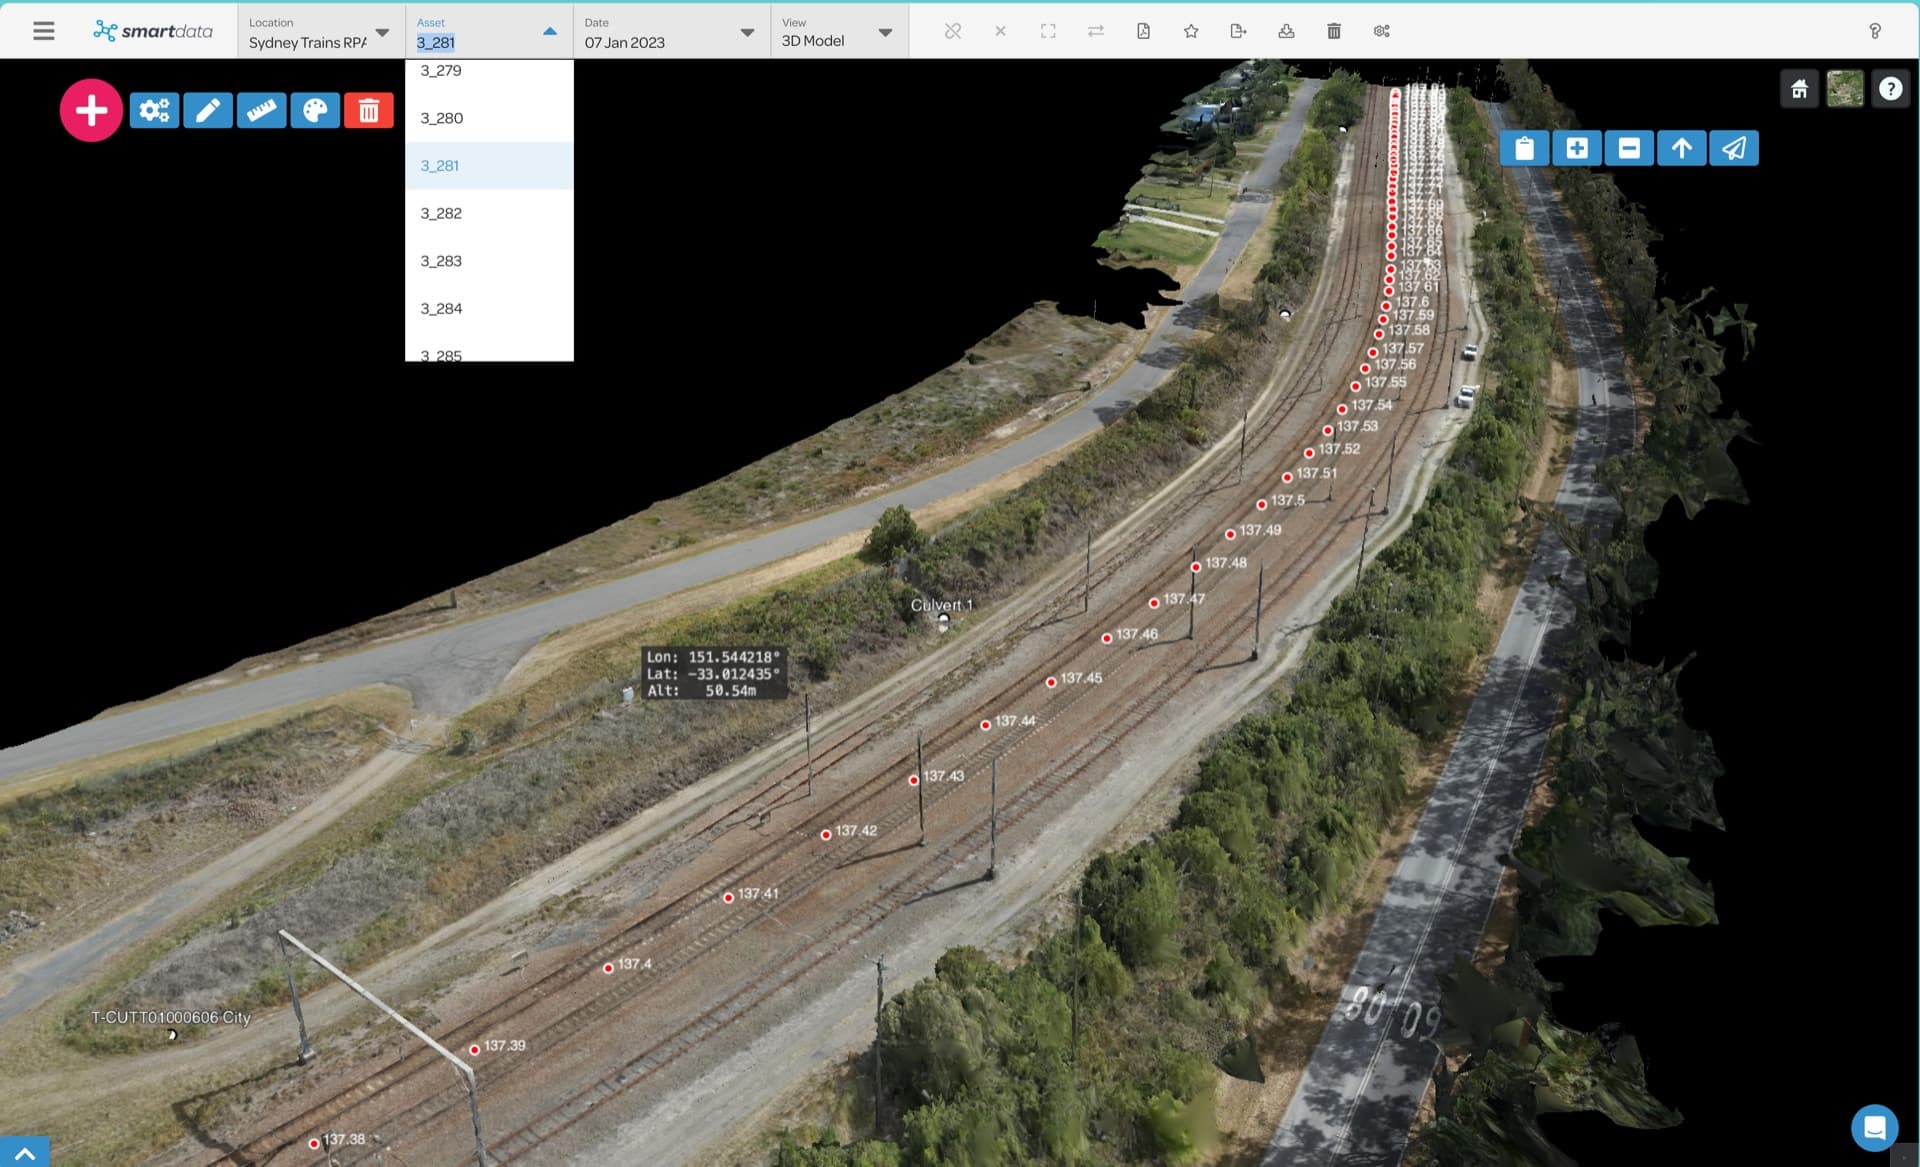
From Aerial Capture to a Usable Survey Dataset
Overlapping drone imagery can produce georeferenced orthomosaics, surface models and 3D point clouds. Processing and quality checks turn the capture into outputs your GIS, CAD or engineering team can use. SmartData provides a browser-based way to review and share the results without each stakeholder handling the full dataset.
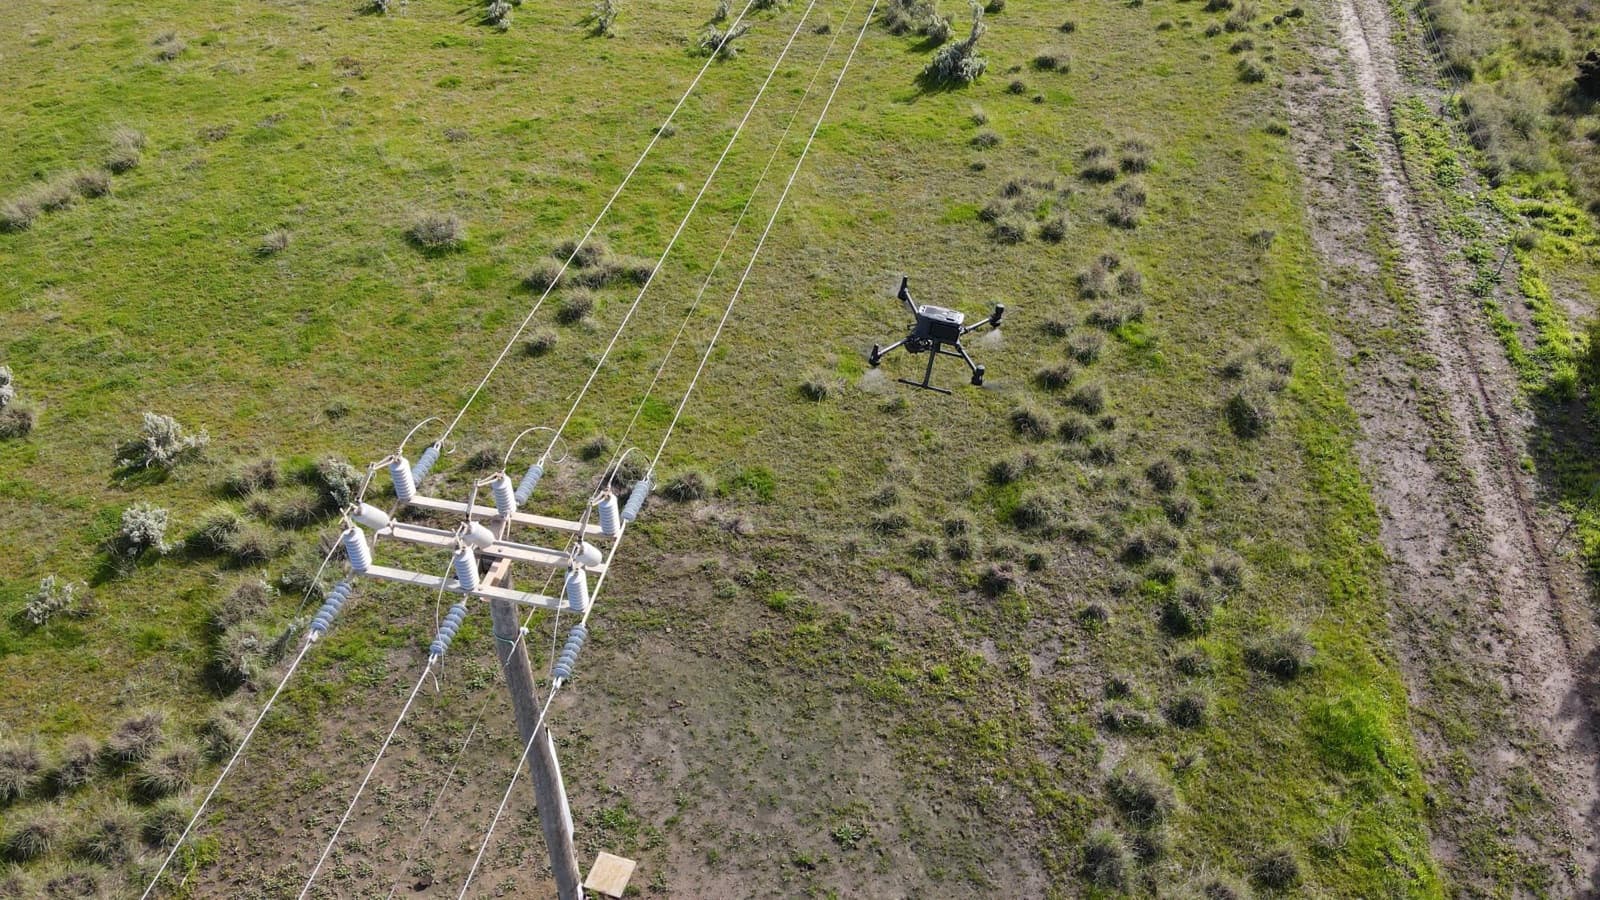
Capture Around Site Access and Operational Risks
Drone capture can reduce the need to enter difficult terrain or work near assets at height. It still requires a site-specific plan for airspace, people, infrastructure and access. We agree safe launch areas, operating windows and any required permissions with your site team before capture.
Specify the Outputs Your Team Needs
Agree deliverables and quality checks before capture, rather than ordering images alone.
- Orthomosaic maps
- Georeferenced imagery for site context, planning and change comparison.
- Terrain and surface models
- Elevation data for design and earthworks, with ground visibility and vegetation limits made clear.
- Point clouds and 3D models
- Detailed geometry for review, measurement and export to the agreed workflow.
- Volumes and repeat surveys
- Stockpile quantities and progress comparisons using agreed boundaries and reference surfaces.
Large Area BVLOS Surveys
Fixed-wing capture can support large mine leases and other suitable sites. Our Olympic Dam project delivered orthomosaics, models and contours for BHP's spatial database. Flight planning and approvals are specific to each operation.
Real Results
See how we have delivered for clients across Australia.
Mining & Resource Exploration
Mapping the Future: A Large Area Drone Survey Covering 250 km²
QEM Limited
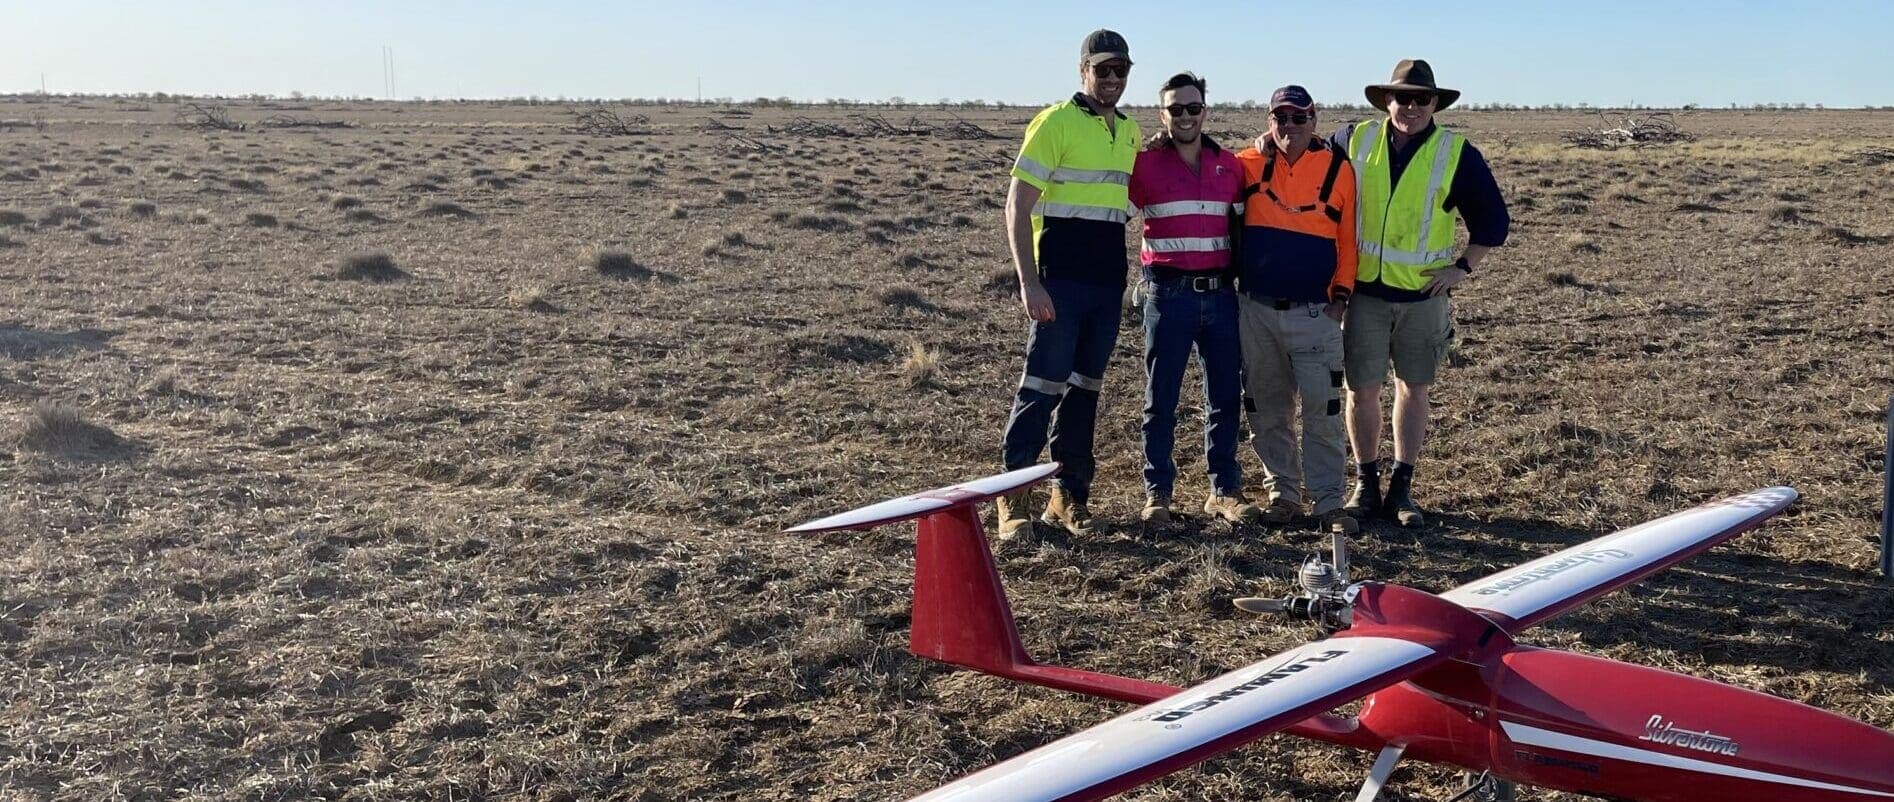
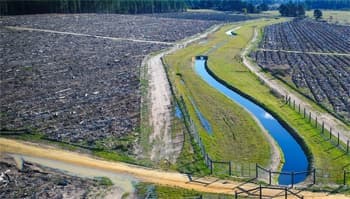
National Drones partnered with Silvertone and QEM to conduct an extensive BVLOS aerial survey spanning 250 square kilometres, creating detailed orthomosaic and digital elevation models.
Water & Wastewater
Gippsland Water
National Drones partnered with Gippsland Water to reduce maintenance inspection times and gain greater insights into asset condition via aerial survey, thermal imaging, and NDVI analysis.
Mining
BHP Olympic Dam — BVLOS Survey
BHP
National Drones conducted a BVLOS aerial survey of BHP's 180km² Olympic Dam mine site in South Australia, one of the largest ever covered by survey drone in Australia.
Frequently Asked Questions
- How accurate is drone surveying compared to traditional methods?
- Accuracy depends on the sensor, flight design, ground control, site conditions and processing. We agree the coordinate system, resolution and required accuracy before capture, and define independent checks where required. An aerial survey supports survey workflows; it does not replace a licensed cadastral survey for legal property boundaries.
- What deliverables do I receive from a drone survey?
- Your agreed scope can include a georeferenced orthomosaic, digital surface model, classified point cloud, contours or stockpile-volume report. A bare-earth terrain model depends on adequate ground observations and may require LiDAR on vegetated sites. We confirm file formats, coordinate reference system and SmartData access with your team before delivery.
- How long does a drone survey take?
- The schedule depends on site area, access, airspace, weather, ground control and the outputs required. Capture is only one stage: processing, quality checks and reporting also need time. We confirm a project schedule after reviewing your survey boundary and specification. Large-area BVLOS work is subject to the required operational approvals.
- Should I choose aerial photogrammetry or LiDAR?
- Photogrammetry uses overlapping photographs to create maps and 3D models and is useful on open, visible surfaces. LiDAR measures 3D geometry directly and can provide ground observations through gaps in vegetation. The best choice depends on vegetation cover, surface detail, accuracy and the decision your data must support.
Scope Your Aerial Survey
Send the site location and boundary, intended use, coordinate system, accuracy requirements and target date. We will confirm the capture method and deliverables.