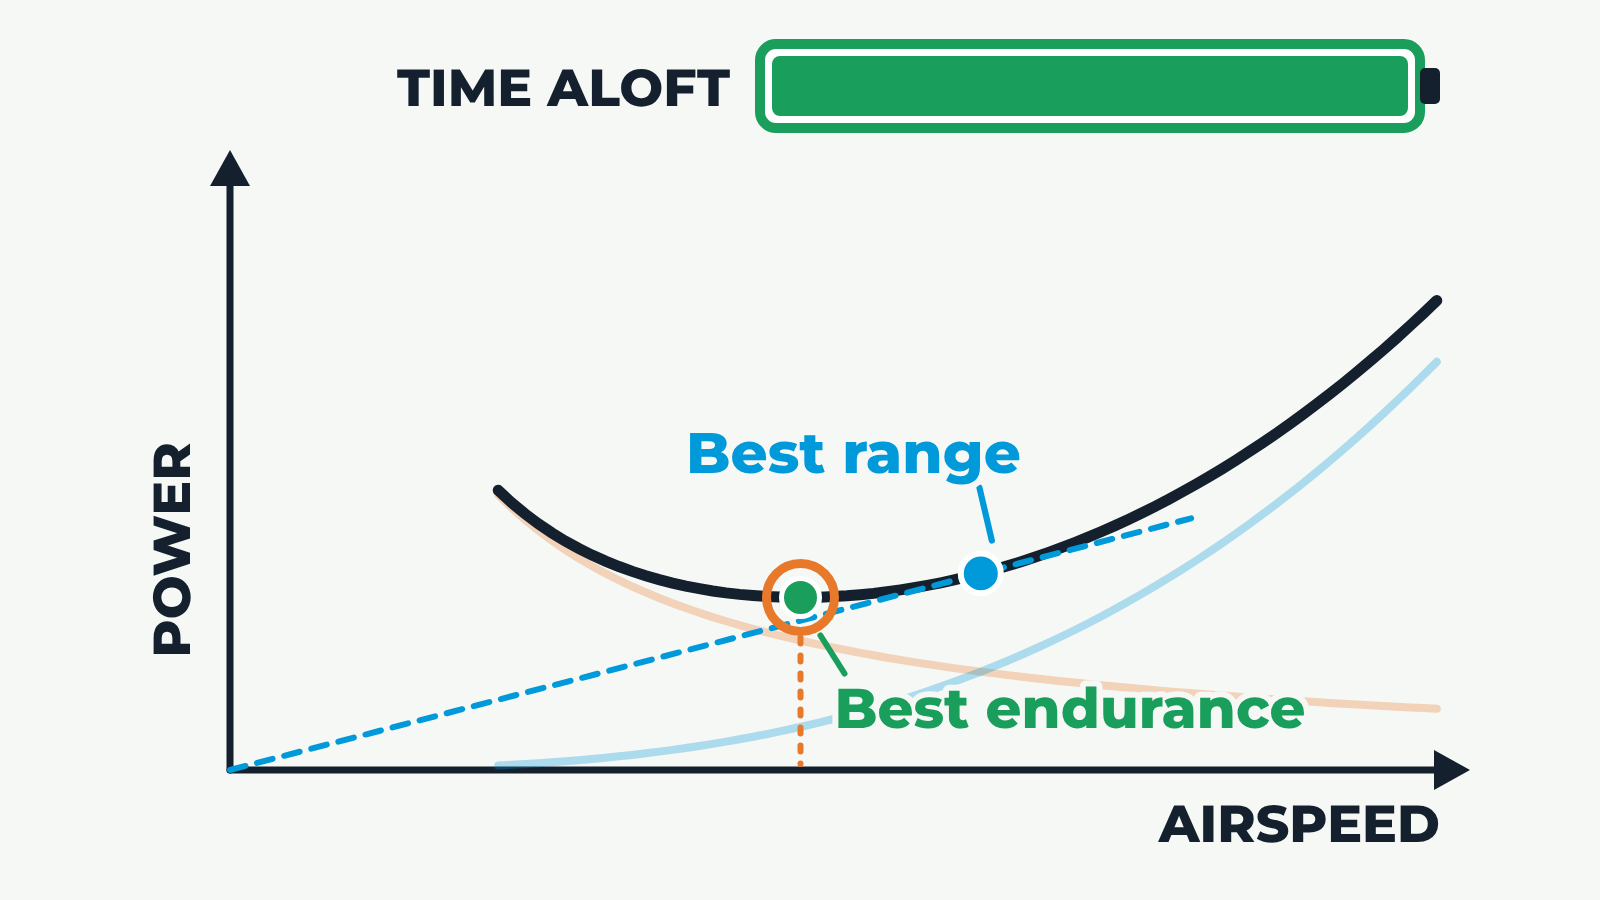
Schematic curve: no scale. Move the airspeed slider to see the time aloft change.
A schematic graph of power required against airspeed, with no numbers. Induced power is high at low speed and falls as speed increases. Parasite power is low at low speed and rises steeply at high speed. Added together they make a U-shaped total power curve. A marker slides along the curve: flying too slow or too fast needs more power, so the time-aloft bar shrinks. At the bottom of the U, minimum power, the time aloft is longest: best endurance. A line from the origin touches the curve at a slightly higher speed: minimum drag, best range. Payload raises the curve and moves the best endurance point; climbing raises the whole curve, so time aloft falls.