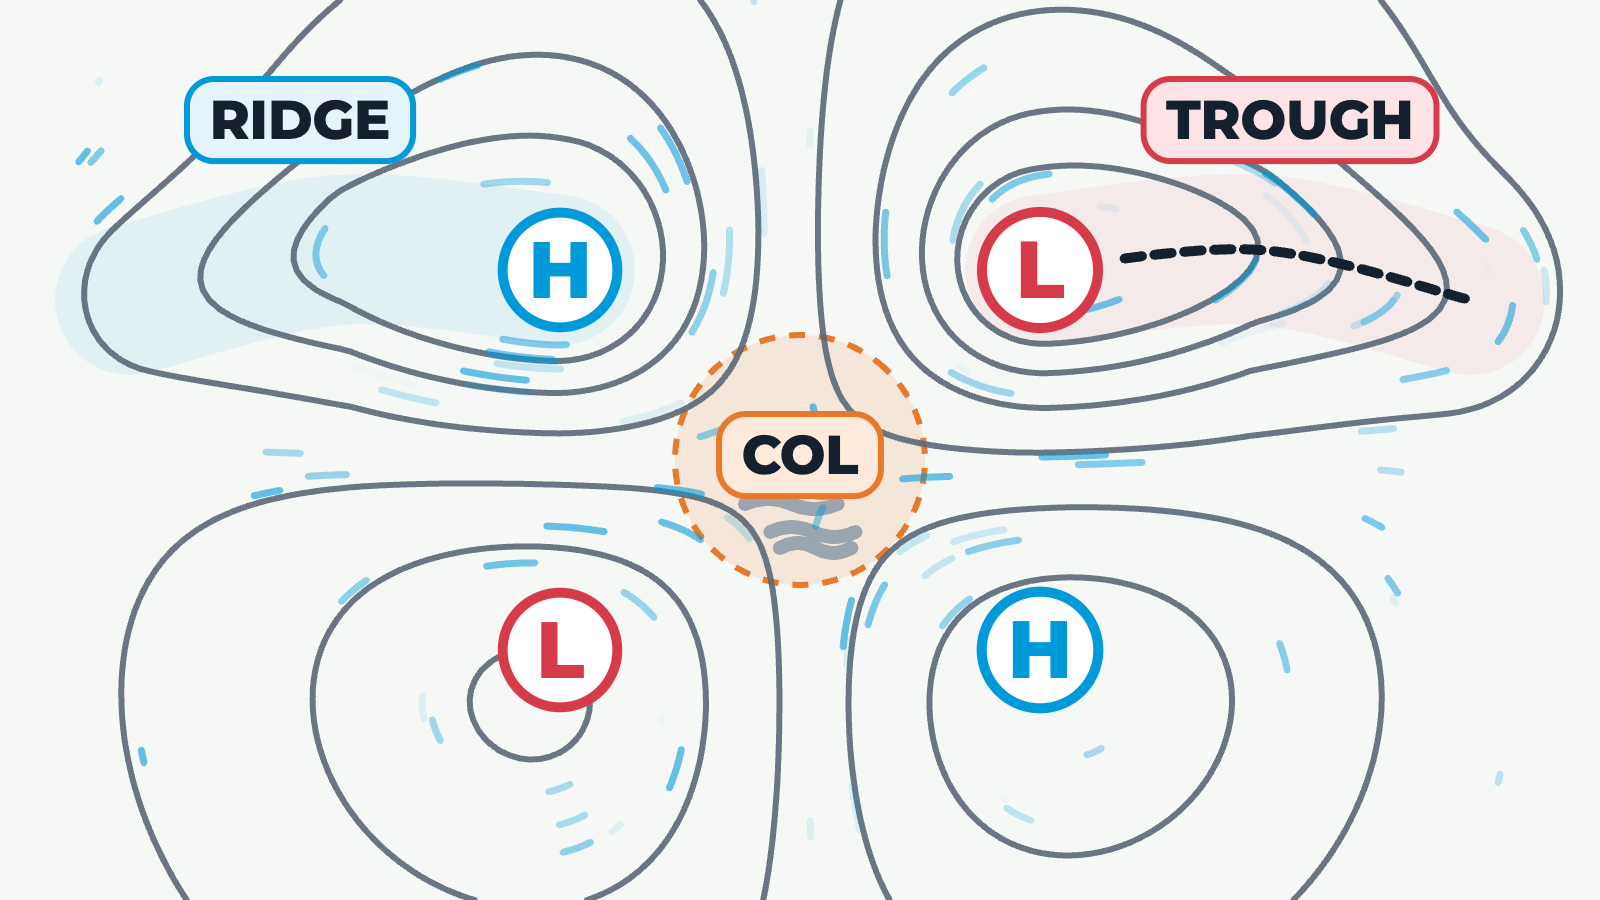
An example Southern Hemisphere chart, not a forecast, with two highs and two lows arranged in a cross. First a ridge is highlighted: the isobars bulge outward from a high in a long tongue of higher pressure, where winds are light. Next a trough is highlighted: the isobars dip outward from a low along a dashed line, and the wind changes direction across it. Finally the col is highlighted: the flat area of almost uniform pressure between the two highs and two lows, where winds are light and variable and fog can form overnight.