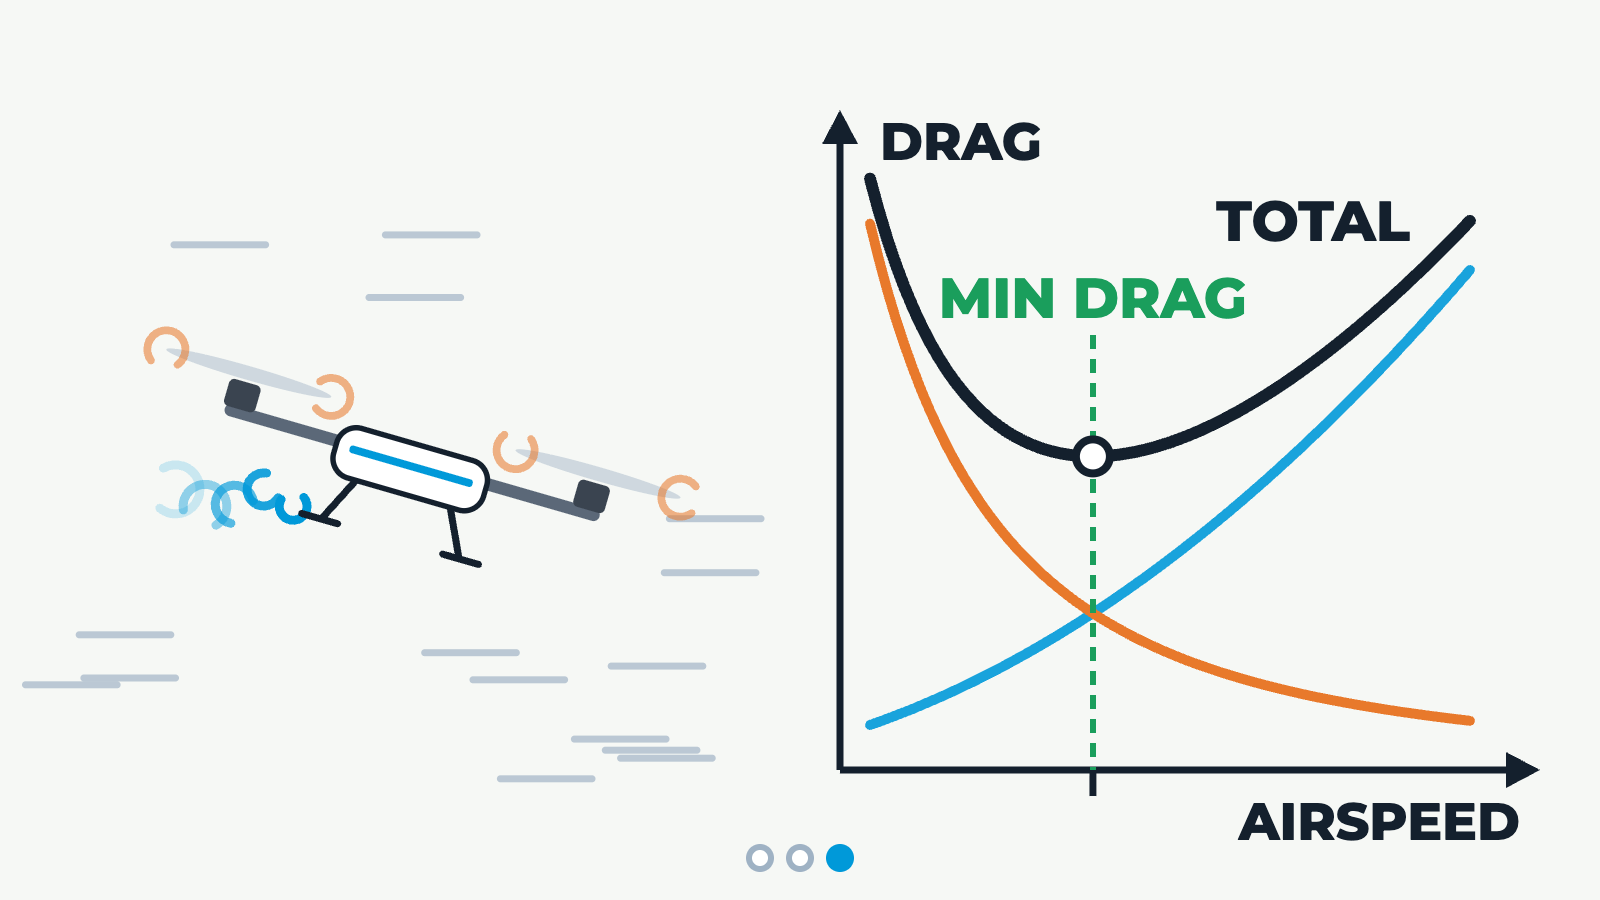
Left: a multirotor flying forward, with air streaming past it. Right: a schematic graph of drag against airspeed, with no numbers. Step 1, parasite drag: as airspeed increases, the turbulent wake behind the aircraft grows and the parasite drag curve rises with the square of airspeed. Step 2, induced drag: at low airspeed the rotor tip vortices are large and induced drag is high; as airspeed increases the vortices shrink and the induced drag curve falls. Step 3, total drag: total drag is parasite plus induced. It is high at low speed and at high speed, with a minimum in between, marked min drag. The Airspeed slider moves the aircraft's speed along the graph. Curves are illustrative.